
New Separation Testing Runs
Message boards :
News :
New Separation Testing Runs
Message board moderation
| Author | Message |
|---|---|
 Tom Donlon Tom DonlonSend message Joined: 10 Apr 19 Posts: 408 Credit: 120,203,200 RAC: 0 |
Hi Everyone, Looking at all of the previous runs (including those from previous projects), there are patterns of interesting and unexpected behavior from the optimization results. In order to better understand these results, I have planned a series of extensive testing runs. These tests will allow us to learn how the optimization routine's responds to specific circumstances and inputs. I will make a comment attached to this post describing the tests & reasons for the tests in greater detail if anyone is interested. EVERYTHING IS WORKING AS INTENDED. These results are not entirely understood, not incorrect. I don't expect to invalidate any results from this project, but I do plan on actually producing more, better results as I learn why the optimizer outputs what it does. I am rolling out the first 2 series of tests, and have released the runs on the server. The names of these runs are: de_modfit_14_bundle5_testing_4s3f_1 de_modfit_14_bundle5_testing_4s3f_2 de_modfit_14_bundle5_testing_4s3f_3 de_modfit_14_bundle4_testing_3s4f_1 de_modfit_14_bundle4_testing_3s4f_2 de_modfit_14_bundle4_testing_3s4f_3 Please let me know if you experience any problems with these runs. Thank you all for your help with this project! Best, Tom |
|
Tom Donlon Send message Joined: 10 Apr 19 Posts: 408 Credit: 120,203,200 RAC: 0 |
If you are not interested in the specifics behind the reasoning for these tests or the project specifics, please feel free to skip this comment. This comment is not a news post, so you aren't missing anything crucial to the project. I've learned that many of the volunteers for our project are not familiar with what the project actually does behind the scenes, so I'll take a brief moment to describe what the Separation Application is, and what it does. Milkyway@home has two projects: The first, original project is the Separation Application. The second project is N-body (which I will not be discussing here, but feel free to ask Eric about specifics if you are interested). The Separation Application is designed to take in large amounts of Main Sequence Turnoff Stars (stars that are transitioning out of the stage of "life" our Sun is in to become giant stars) and use this data to find substructure within our Milky Way. This is done using Sloan Digital Sky Survey and PanStarrs data. The idea is that the Milky Way has many stellar streams in it. These streams form from dwarf galaxies falling into the Milky Way, and getting stretched out due to the same types of forces that cause tides on Earth. These streams are very sensitive indicators of the gravitational fields that our Galaxy produces. By locating and analyzing these streams, it is possible to extract information about the gravitational forces in different regions of the Milky Way. This information can then be used to determine the where dark matter is located within the Milky Way, since dark matter rich regions should produce much stronger gravitational forces than we expect just from looking at how much light matter is there. By finding the dark matter, we are that much closer to figuring out what dark matter is. The Separation Application attempts to fit a number of stream models (cylinders, basically) to a background Milky Way model in a small stripe of the sky. It then builds a model of where we expect stars to be in the region based on this input, and compares that to the observed data we get from large-scale surveys. This is done through hundreds of thousands of trial and error attempts, where better attempts are used to generate the next generation of attempts (see differential evolution, if you're interested in this process). When you run a workunit for the Separation Application, you are performing the calculations for one of these trials. The results that we get from a run of the Separation Application should tell us where it is most likely that these streams are located in the data stripe. By combining data from many stripes, you are able to follow streams across larger portions of the sky. For the most part, these results appear to look like streams that we see in the sky. In some cases, however, some of the stream results from a stripe will not look like a stream due to the way that the optimizer fit it. Instead of throwing out this data, I intend to see whether or not the optimizer is trying to "tell" us something -- that is, maybe there isn't a stream in that location, but there is something else, and we just don't understand the results well enough to say what that is yet. Maybe the optimizer is doing its best to fit streams that exist in real life, but are outside the range of the data that we are using. Maybe the optimizer returns strange results when there are only 3 streams in the sky but you try to fit 4 model streams, or vice versa. The goal of these tests is to figure out what inputs return what outputs from the optimizer. This will allow us to more confidently interpret the results of the optimizer, and maybe make even more discoveries than we would have otherwise! I'm more than happy to answer any questions that you all have. If you want me to explain anything in greater detail, let me know and I can absolutely do that. [/url] |
|
Joseph Stateson Send message Joined: 18 Nov 08 Posts: 291 Credit: 2,464,814,022 RAC: 37,425 |
I ran a comparison of elapsed time for those testing runs. There is a larger spread of elapsed time for the "testing" as shown in the following graphs. The graphs show five AMD s9x00 co-processors with the top graph data that did not have the word "test" in the dataset name. 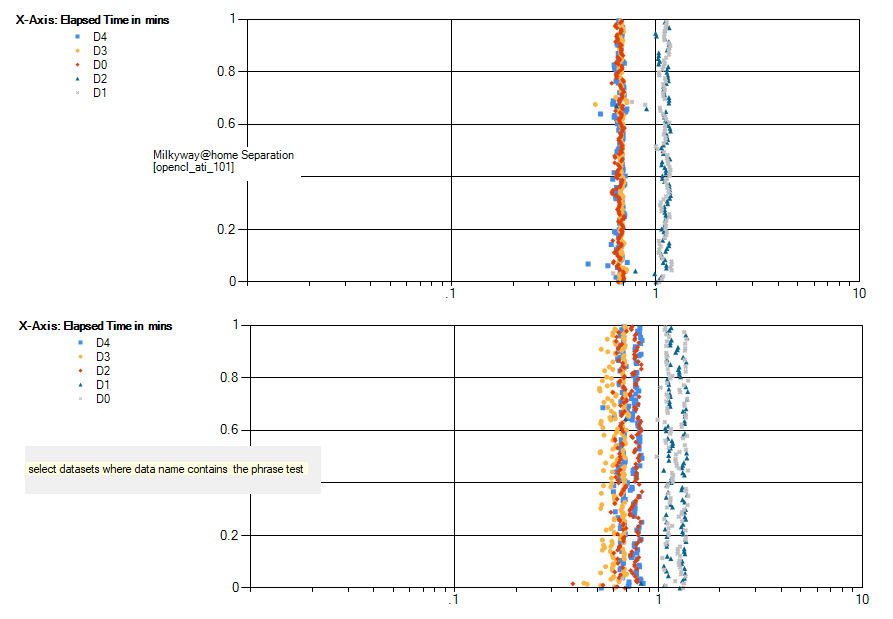 |
|
Tom Donlon Send message Joined: 10 Apr 19 Posts: 408 Credit: 120,203,200 RAC: 0 |
This may be a good thing. Our test runs are known to be searching for the incorrect number of parameters. If our test runs look different than our real runs, then it could be a sign that our actual runs are searching the correct number of parameters. This is just a guess, though, it could be a number of other things. Thanks, Tom |

©2026 Astroinformatics Group